🚀Exciting News!🚀 Enroll Today & Claim upto 20% Off.
Master Data Visualization with Tableau
🎓 Achieve Data Visualization Mastery in Just 9 Hours: Join Our Course Led by Top Industry Experts.
📊 Master Essential Data Visualization Fundamentals & Advanced Techniques, including Key Tools and Visualization Strategies.
⭐⭐⭐⭐⭐ Rated 4.5 with 8775 Ratings


Master Tableau: From Basics to Advanced
Dive into data visualization with Tableau, mastering everything from basics to advanced in 6 hours.
_____________________________

Guided by Esteemed Experts
Gain from a Tableau pro's 15+ years of expertise, enhancing your data analysis and presentation skills.
_________________________________

Abundance of Learning Resources
Explore a rich array of videos, live sessions, and resources, accelerating your learning in 8+ hours.
______________________________
Why Enroll at the PH Academy?

Delivered by Programming Hub, an Esteemed Leader in Tech Education
_____________________________

Celebrated & Featured on Google, Apple, Product Hunt, and lauded by Forbes.
______________________________

Dedicated to offering Comprehensive, Hands-on learning Experiences at Affordable Prices
_______________________________

With over a decade of excellence, Programming Hub has illuminated the path for more than 30 million learners worldwide, boasting an impressive 4.8 rating on both the Google Play Store and Apple App Store. Not only that, but we have helped millions take their first coding steps with us—and the thousands who have since secured their dream tech jobs.
Our commitment has caught the eye of the tech world and beyond, leading to features by prestigious platforms like Google Play Store, Apple App Store, Product Hunt, Forbes, and more.
PH Academy aims making in-depth and practical learning accessible to everyone at pocket-friendly prices.
Course Highlights
Master Data Visualization with Tableau: A Comprehensive Guide to Transforming Data into Insightful Visuals
Welcome to "Tableau for Beginners 2024: Visualize and Analyze Your Data"—an essential journey designed to navigate through the expansive realm of data science with Tableau, tailored for those ready to turn data into actionable intelligence. This course is the ultimate gateway for individuals aiming to decipher the complexities of raw data, fostering informed decision-making through the art of impactful data visualization and storytelling.
In this compelling learning odyssey, you will:
Start your Tableau journey learning to link data sets and build your first worksheet, all user-friendly for beginners. Discover trends and forecast accurately by handling time-based data and extracts. Master data aggregation and granularity for precise summaries and calculations. Dive deep into crafting various charts, maps, and interactive dashboards that illuminate your data. Learn to join and blend data effortlessly, integrating comprehensive information from different sources. Advance into complex Tableau techniques like table calculations and creating compelling, narrative-led presentations.
What Will You Learn -
⏩Fundamentals and advanced techniques of data visualization with Tableau, tailored to various industries.
⏩Strategies for designing compelling Tableau dashboards that effectively communicate insights.
⏩Key principles of data storytelling to influence decision-making processes.
⏩Techniques to enhance user engagement through interactive Tableau visualizations.
⏩Best practices for data preparation and optimization specific to Tableau's environment.
⏩Advanced Tableau features, including calculations, parameters, sets, and analytics extensions.
⏩Utilizing Tableau Server for sharing insights, collaborating on projects, and scaling your data visualization capabilities.
⏩Insights into predictive analytics with Tableau for forecasting and trend analysis.
⏩The role of Tableau within the broader data analytics lifecycle and how it supports data-driven strategies.
Key Highlights -
✅ Learn from Top Faculty & Industry Practitioners
✅ Dedicated Learning Management Team
✅Lifetime Access and Future Updates
✅ Get Certified by Programming Hub
✅ Designed for Students, Working Professionals and Freshers

Course Faculty

Prof. Asmita Ranade
Data Analyst | Educator with 20+ Years of Experience
Asmita Ranade brings over two decades of expertise as an Assistant Professor in Computer Science & Information Technology, with a strong focus on data analysis. She initiated the M.Sc. (Data Science & Big Data Analytics) program at B. K. Birla College, reflecting her ability to lead academic innovations. Renowned for her contributions to the University of Mumbai's curriculum as a course writer and member of the Syllabus Design Committee for IT, Asmita's work spans several key areas including Big Data Analytics, Advanced DBMS, and more.
Her comprehensive approach to education blends analytical acumen with a dedication to leveraging new technologies to enhance learning and professional growth in students.
Course Modules
19 Sections | 50 Lessons | 8+ Hours
- 15.1 Dashboard Design Objectives (7:00)
- 15.2 Designing Power Consumption in India Dashboard from scratch (29:40)
- 15.3 Designing Books my sister_read Analysis Dashboard from scratch (29:32)
- 15.4 Building India-China Population Pyramid by reshaping the data (15:34)
- 15.5 Designing SuperStore Dashboard from scratch (22:15)
- 15.6 Designing Story-IPL Statistics 2008 to 2017 (73:34)
Course Certificate
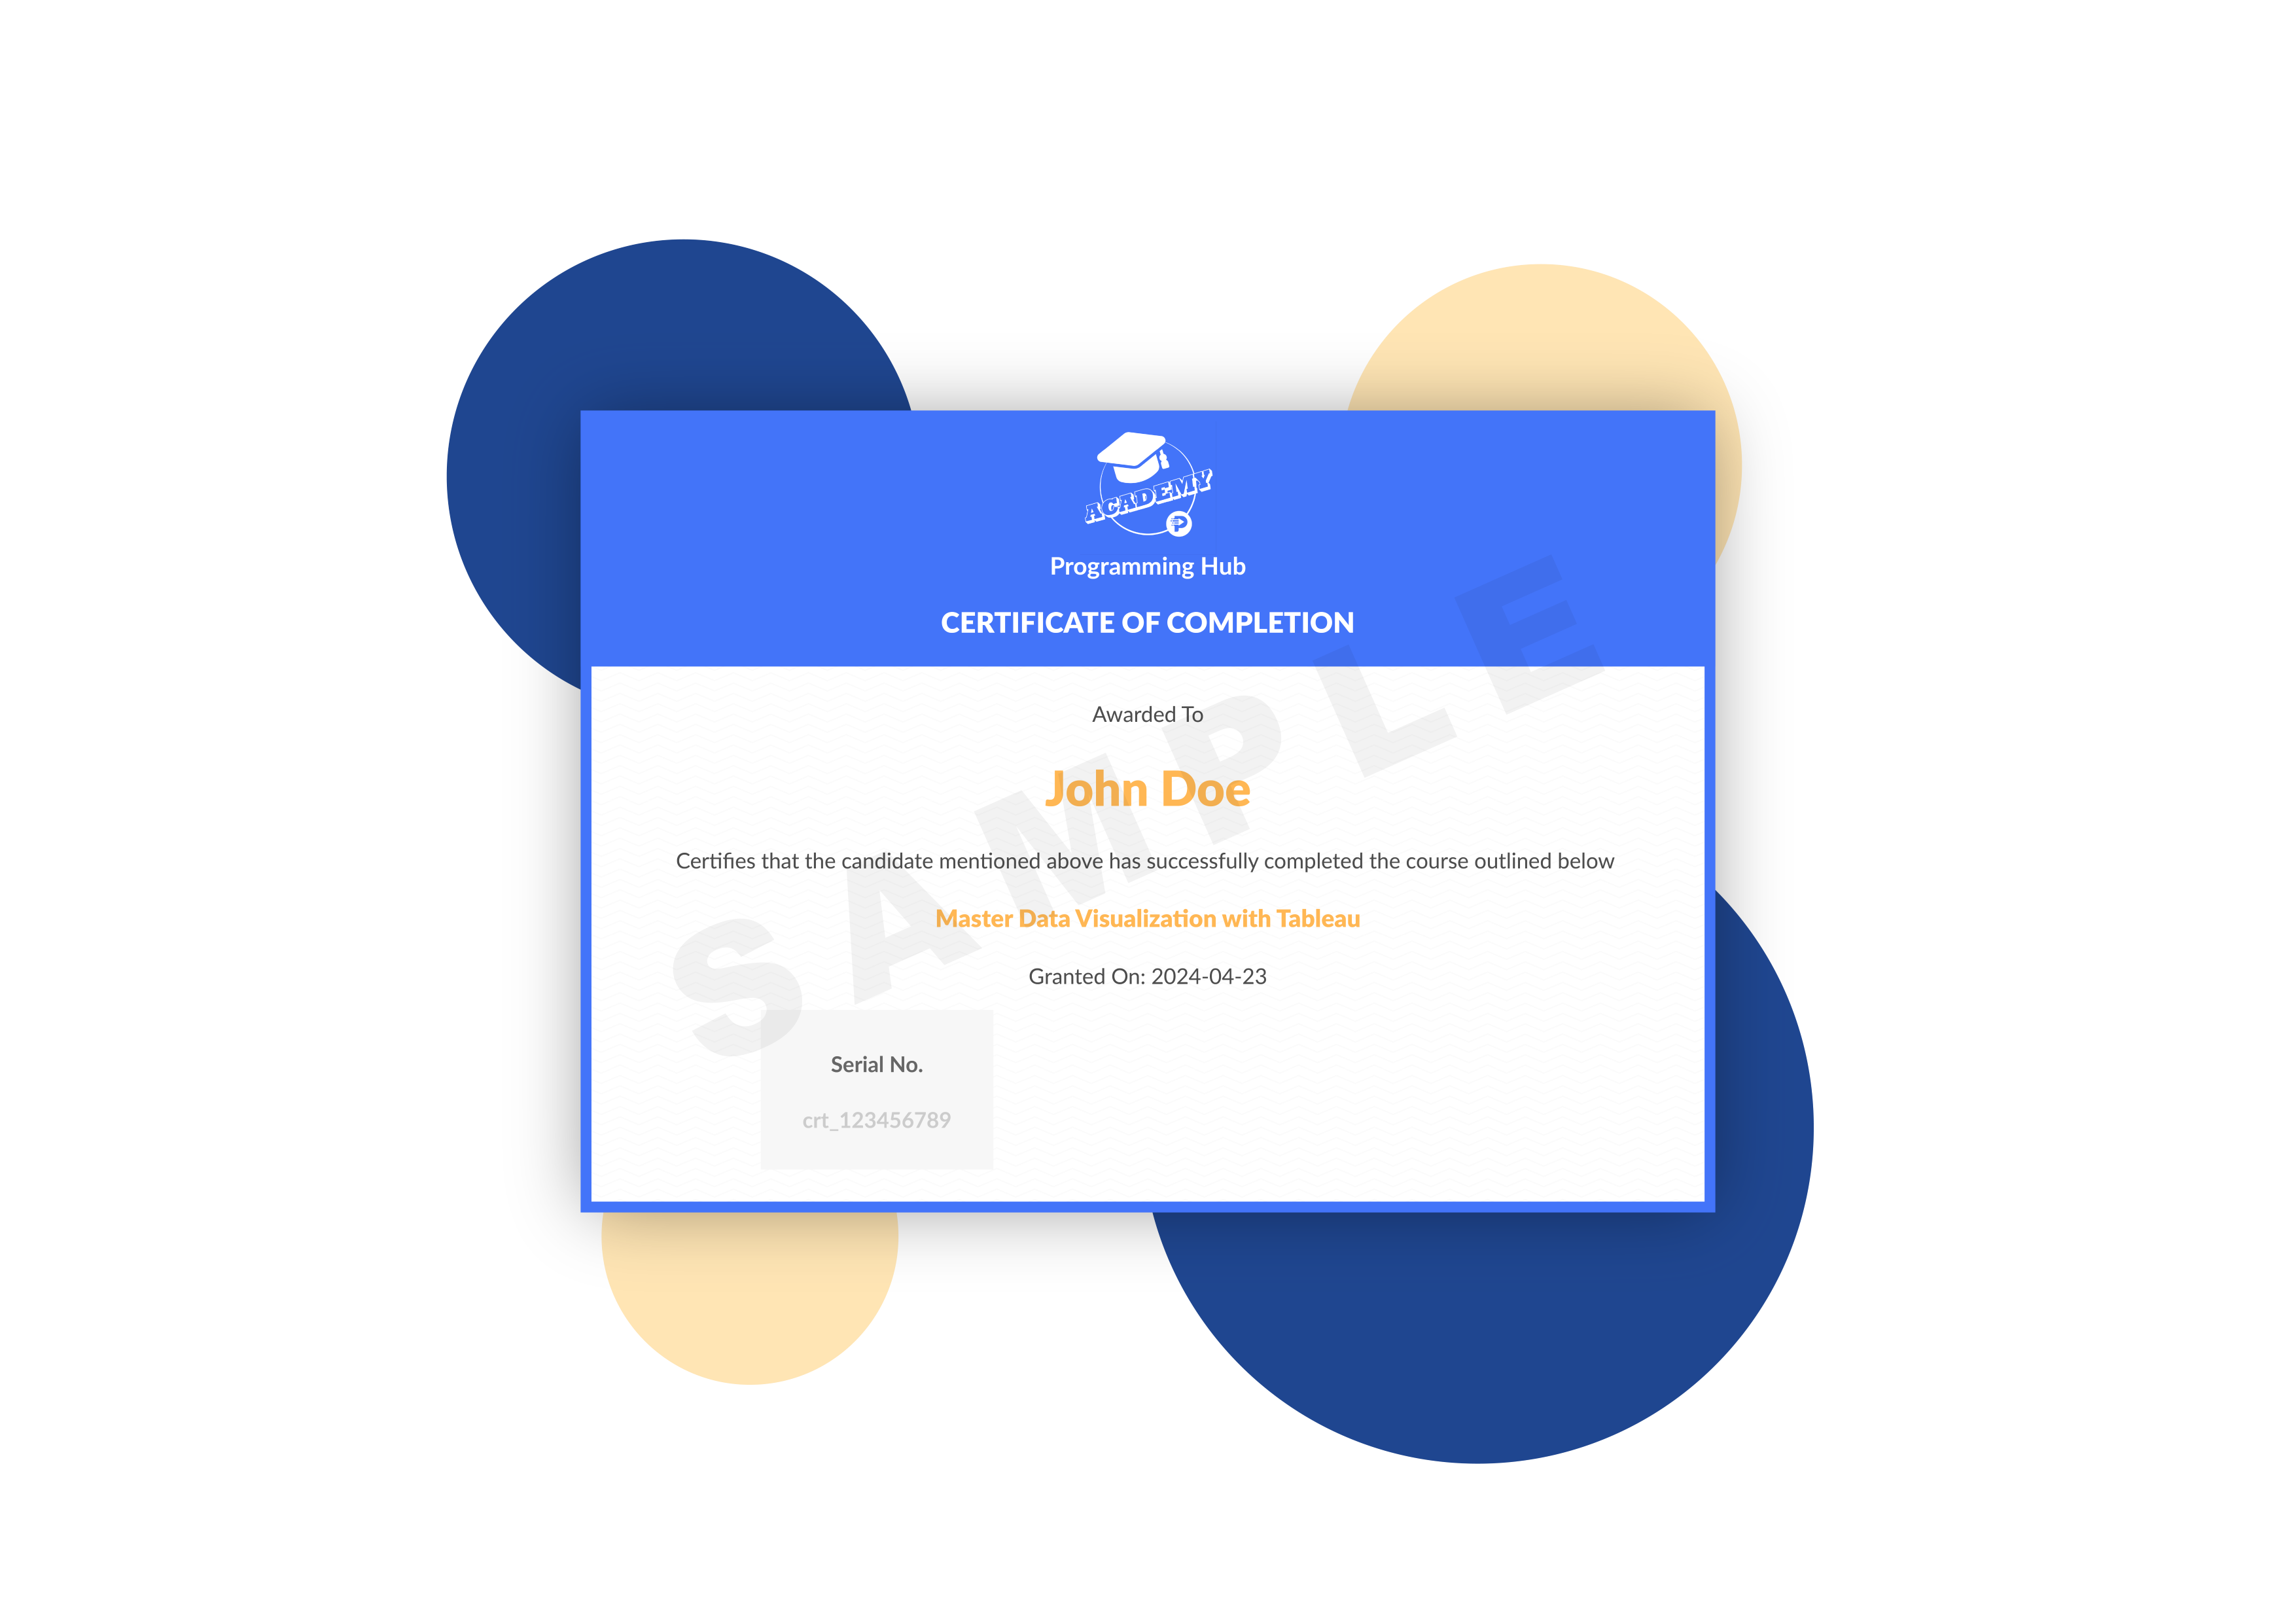
Earn a Tableau Data Visualization Certificate
Boost your professional stature by displaying your newest certification on platforms such as LinkedIn, Twitter, and professional Data Visualization communities. Emphasize the importance and the skills acquired from this in-depth Tableau Data Visualization course to broaden your career prospects, showcasing your dedication to continuous learning and career growth in the rapidly evolving field of data visualization.
Who can Enroll for the Course?
This in-depth Data Visualization with Tableau course is thoughtfully designed for a wide audience, accommodating both beginners eager to explore the world of data visualization and seasoned professionals looking to deepen their expertise in this rapidly evolving domain. Whether you're:

Aspiring Data Analysts
If you're starting your journey in data visualization, this course will lay a solid foundation in the discipline, specifically through the use of Tableau.
_______________________________

Tech Savvy Professionals
For those already working in the tech industry but but aiming to transition to roles that demand proficiency in Data Visualization Tools.
________________________________

Career Shifters
For individuals interested in switching to the data centric industry, mastering Tableau can unlock a plethora of opportunities.
____________________________
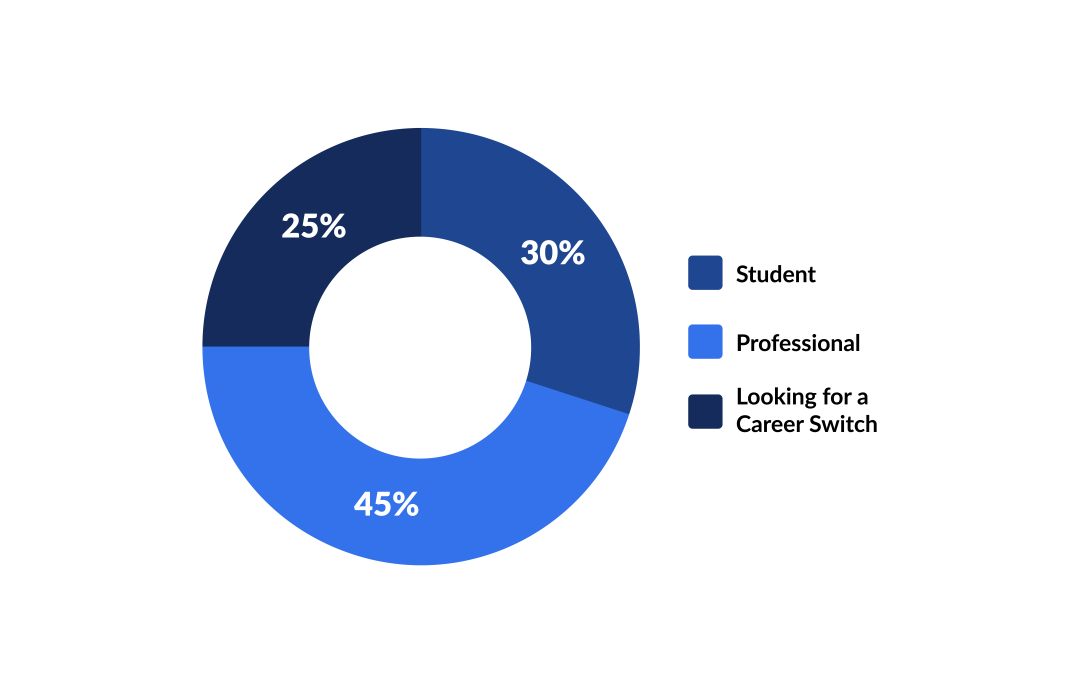
Past Participant Profile
Top Learner Background & Industries
Student: School Kids
Student: College Graduates
Student: Post-Graduates
Information Technology / Services
Internet / E-commerce
Pharmaceuticals / Biotechnology / Healthcare
Education/Ed-Tech
Others
Career Roles and Fields for Tableau and Data Visualization Experts
✅ Data Visualization Specialist: Design and execute sophisticated data visualization projects using Tableau, transforming complex datasets into intuitive and engaging visual stories to inform strategic decisions.
✅ Business Intelligence Analyst: Leverage Tableau to extract insights from data, supporting business objectives by illustrating trends, patterns, and predictions through dashboards and reports.
✅ Tableau Consultant: Offer expert guidance and solutions in Tableau for various clients, optimizing their data visualization capabilities and empowering them to understand their data with greater clarity.
✅ Analytics Manager: Manage a team of analysts to provide comprehensive analytics support across an organization, utilizing Tableau to visualize data and insights that drive business strategy and performance improvement.
✅ Data Storyteller: Craft compelling stories with data, using Tableau to create visual narratives that communicate complex information simply and persuasively to diverse audiences.
✅ BI Developer: Specialize in developing business intelligence (BI) solutions, utilizing Tableau to create advanced dashboards and analytics platforms that enhance data accessibility and decision-making processes.
✅ Data Science Consultant: Apply expertise in Tableau within the realm of data science, using visual analytics to support data-driven strategies and insights for organizational growth and efficiency.
✅ Marketing Analytics Specialist: Use Tableau to analyze marketing performance data, crafting visualizations that pinpoint the effectiveness of various channels and campaigns in driving target outcomes.
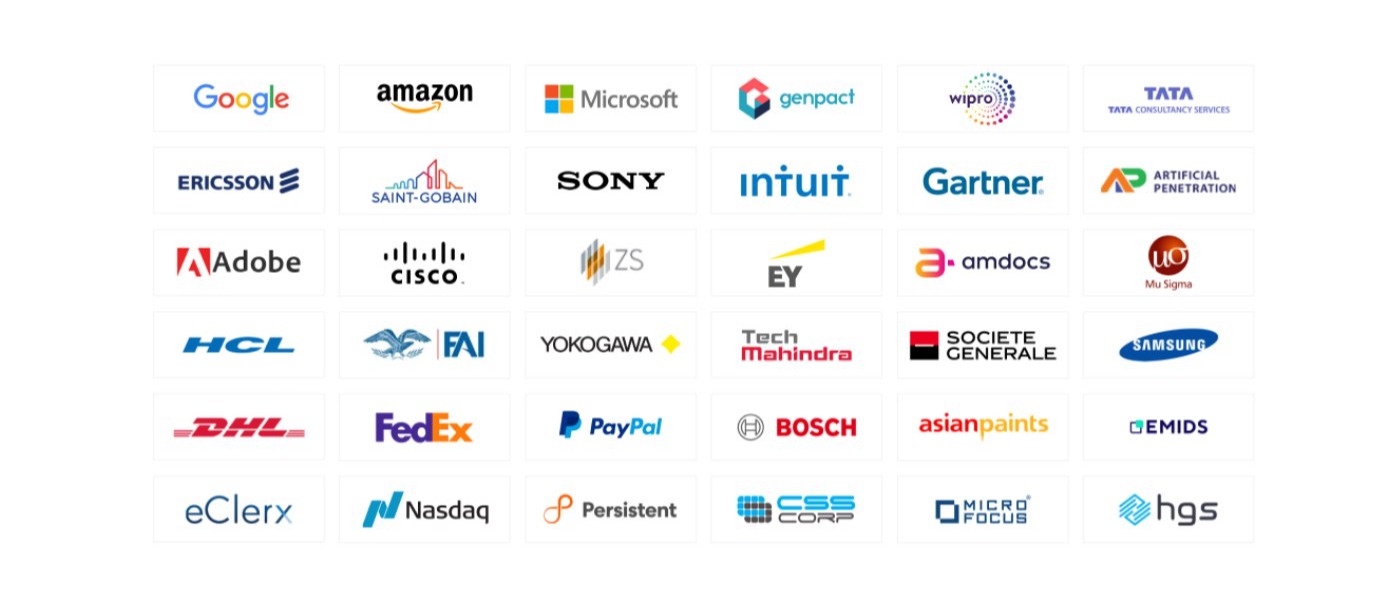
Our Alumini Work At
From the Academy Community

Lucas Müller (Germany)
____________________________
"This Tableau Data Visualization course has completely changed how I see data! The structure of the course was impeccably designed, making complex information easily digestible through engaging hands-on projects. I now feel confident in my ability to transform raw data into meaningful insights. Highly recommended for anyone looking to master Data Visualization with Tableau."

Sophia David (Canada)
____________________________
"The step-by-step methodology employed in this Tableau course made mastering sophisticated data visualization techniques surprisingly accessible. The instructor’s expertise and personalized feedback significantly enhanced my learning experience. I now navigate the landscape of data analytics with confidence. An absolute thumbs up for this outstanding Tableau course!"

Aleksander Ivanov (Ukraine)
____________________________
"Having enrolled in various data visualization courses before, this one truly stands out. The clarity in instruction and the practical approach to assignments have made abstract Tableau concepts tangible and understandable. It shifted my view of data visualization from challenging to entirely achievable. This course is a must-have for anyone diving into the world of data with Tableau!"
Begin your Tableau Data Visualization journey with confidence. If the course doesn't align with your expectations, take advantage of our straightforward refund policy within 7 days—no questions asked. Launch into your Tableau adventure today, completely risk-free!
BONUS 🎁
(Only for First 150 Students, 73 Seats Left…)

Exclusive Live Tableau Sessions
Explore Tableau Data Visualization through live sessions, connecting with experts and peers for a deeper insight and networking opportunities.
________________________________

Master Your Interviews:
Resources at 30% Off
Enjoy 30% off our curated resources including interview questions and cheat sheets, designed to refine your Tableau skills and boost interview confidence.
___________________________________

Stay Ahead with Our Tableau Newsletter
Stay informed and continue learning with our newsletter, packed with the latest trends and innovative techniques in Tableau Data Visualization.
________________________________
Frequently Asked Questions 🤔
⏩ Will I get lifetime access to the courses?
Yes, you'll receive lifetime access to all purchased courses on Academy by Programming Hub. This means you can revisit the material and learn at your own pace, forever! Also, you will receive timely updates about course updates.
⏩ How is PH Academy different from Pro Access of the Programming Hub App?
Programming Hub has long been celebrated for its comprehensive coding tutorials accessible through our mobile app with the PRO subscription. However, we’re taking a giant leap forward with our newest offering, Academy by Programming Hub. In contrast to the bite-sized tutorials in the app, Academy offers video courses led by industry experts, designed for an immersive learning experience to scratch to advanced levels.
These in-depth courses are tailored to make learners job-ready, featuring real-world projects, dedicated support, and official certifications. Academy is your bridge to mastering tech skills and securing your dream job in the industry.
⏩ Can I download the video lessons?
You'll be able to download supplemental resources like code snippets, templates, and cheat sheets. However, the video lectures can only be streamed.
⏩ Do the courses offer any certifications?
All courses offer certificates of completion upon finishing the course and passing any required assessments. Check the individual course description for details.
⏩ Why is learning with “PH Academy” special?
Along with industry experts, we have crafted a perfect path to learn programming, marketing, design, and more. You will not only acquire new skills but also enjoy the process like a game. It's easy, it's fast, and it's fun!
Learning a new skill is often considered difficult and boring. But not anymore; we have made learning a new skill fun and interactive so that people enjoy the process.
⏩ What is the refund policy for this program?
Yes, our course comes with a no-questions-asked 7-day refund policy. If for any reason you're not satisfied with the program, you can request a full refund within 7 days of purchase. We aim to create a risk-free environment for you to explore and learn.
⏩ What are the prerequisites for this course?
No, there are no prerequisites for this course. It is designed to be beginner-friendly, welcoming students of all backgrounds. Our approach ensures everyone can start from the basics and progressively build up their knowledge. All you need is an eagerness to learn. Welcome aboard!
⏩ What is the mode of the program? Are there live sessions in the program?
The course is structured around pre-recorded lectures. This enables students to learn at their own pace, access the content at any time, and revisit the material as needed for deeper understanding or review.
While the core content of our program is delivered through recorded lectures, enrolled students may have the opportunity to participate in live sessions. These live sessions are offered as a bonus and are not mandatory parts of the curriculum. Invitations to these live sessions are extended to enrolled students as and when they are scheduled.